Infection Rate Explained: What It Is and Why It Matters
Ever seen headlines talking about an "infection rate" and wondered what the fuss is about? You're not alone. The term pops up in news about COVID, flu, and even local outbreaks, but most people don't know the basics. In the next few minutes, we'll break down the definition, the math behind it, and how you can use the number to make better health decisions.
How experts calculate the infection rate
The infection rate is basically the number of new cases that show up over a set period, divided by the total number of people at risk. Think of it as a slice of a pie: if 100 new cases appear in a town of 10,000 residents in a week, the weekly infection rate is 1% (100 ÷ 10,000). Some reports use "R0" or "reproduction number" instead, but the core idea stays the same – it tells you how fast a disease is spreading.
There are a few ways to tweak the formula. Health agencies often use a 7‑day rolling average to smooth out daily spikes, especially when testing numbers fluctuate. They might also separate confirmed cases from probable ones, or adjust for population density. The goal is to give a clear picture without the noise.
What the number means for everyday life
A low infection rate (say, under 0.5%) usually signals that the outbreak is under control. You’ll see fewer headlines, fewer restrictions, and a return to normal activities. A high rate (above 2% in a short window) means the disease is gaining ground, and you might see mask mandates, travel advisories, or vaccination drives.
But the raw number isn’t the whole story. Look at trends: a steady rise over weeks is more worrisome than a single day spike. Also, compare the rate to local factors – crowded events, schools opening, or a new variant can push the number up even if the overall case count seems stable.
Here’s a practical tip: when you see an infection rate update, ask yourself three quick questions. First, is the rate rising, falling, or flat? Second, how does it compare to the previous week? Third, what local actions are authorities taking in response? Answering these helps you decide whether to keep your routine, add extra precautions, or maybe even skip a big gathering.
Another useful trick is to relate the rate to personal risk. If the infection rate is 1% in your city, that means roughly 1 in 100 people got infected that period. If you mingle with 10 new people, statistically you have about a 10% chance of meeting an infected person. Knowing this, you can choose safer settings – outdoor meetups, smaller groups, or better ventilation.
Finally, remember that infection rates can differ dramatically between neighborhoods. Even in the same city, one area might have a rate of 0.2% while another sits at 3%. Use local dashboards or health department apps to get the most accurate data for where you live or work.
Bottom line: the infection rate is a simple fraction that tells you how quickly a disease is spreading. By watching the number, noticing trends, and matching it to local actions, you can make smarter choices about masks, gatherings, and travel. Stay curious, keep an eye on trusted sources, and let the data guide you rather than fear. That's how you turn a confusing statistic into a useful tool for everyday safety.
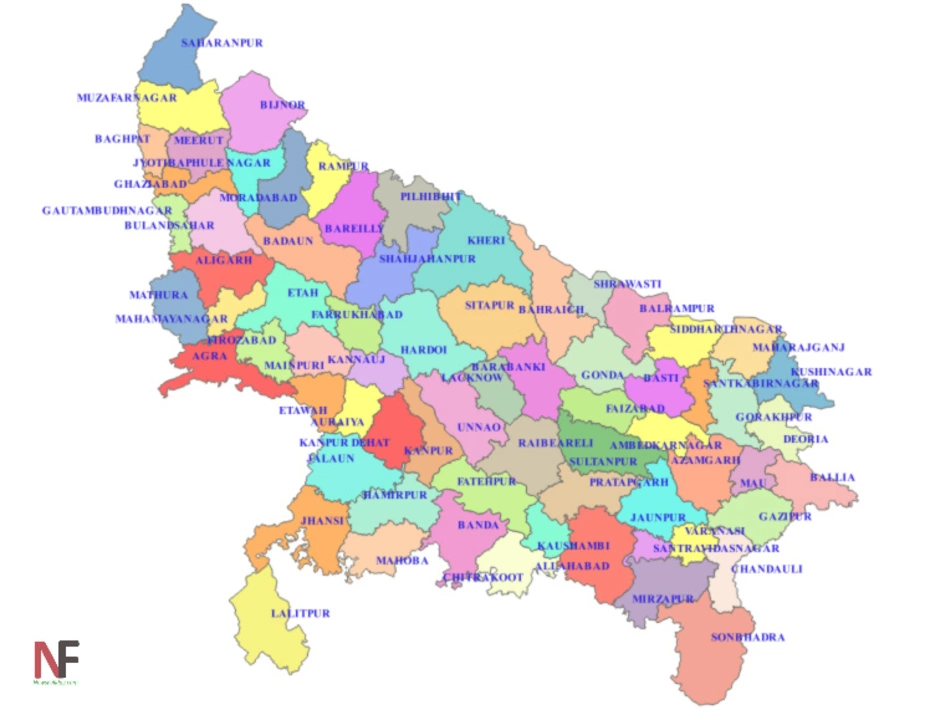
Uttar Pradesh: No slowing of infection, Jhansi sees fresh uptick?
I just came across some concerning news about the COVID-19 situation in Uttar Pradesh. It seems that the infection rate is not slowing down, and unfortunately, Jhansi is witnessing a fresh uptick in cases. This is quite worrisome as it could potentially lead to increased pressure on the healthcare system. It's crucial for everyone to follow safety measures and get vaccinated to curb the spread of the virus. Let's hope that the situation improves soon and we can overcome this challenging period together.
View more